Expenses Chart
12th October 2023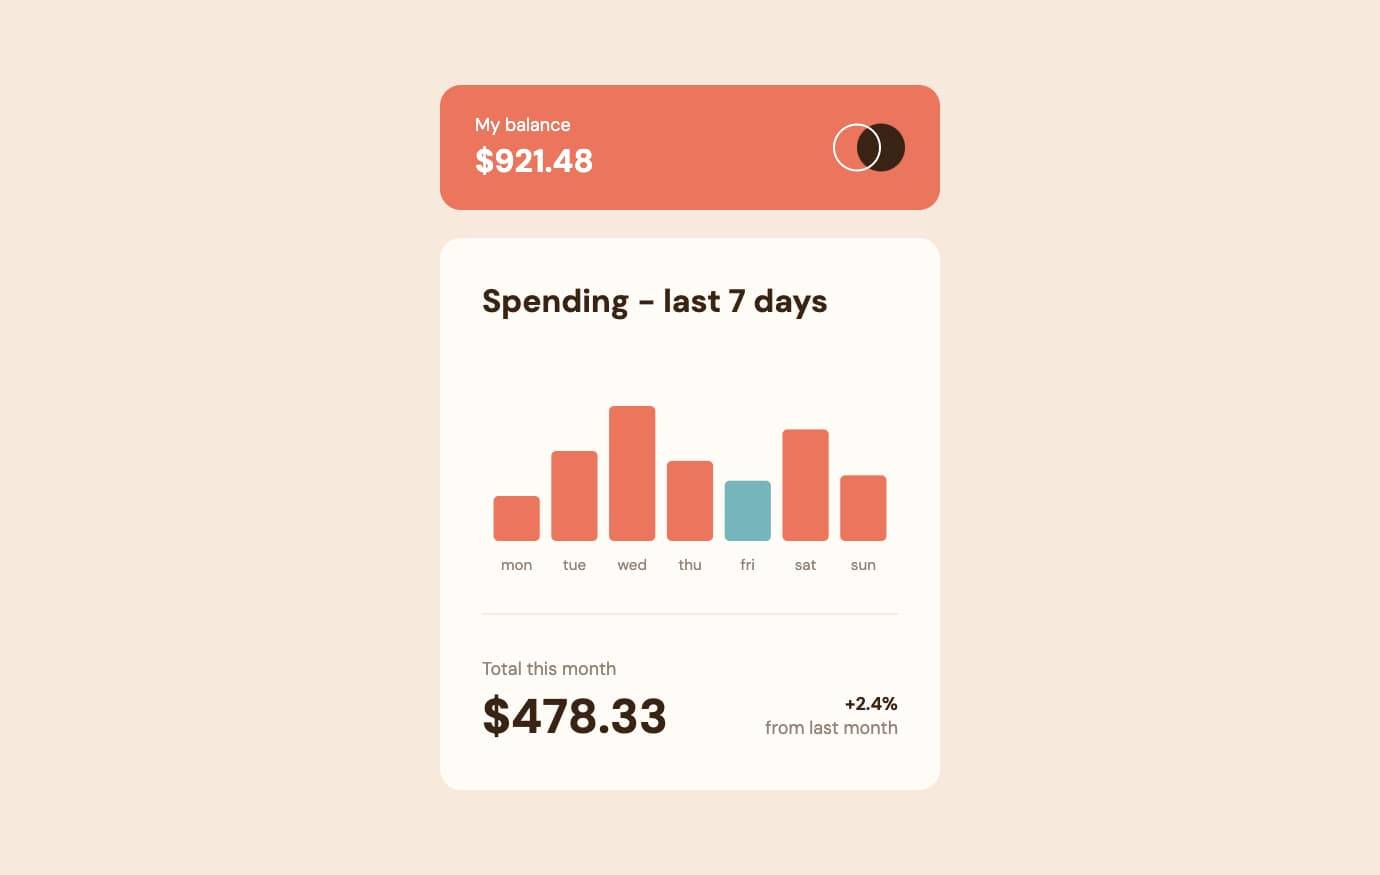
Challenge requirements
Users should be able to:- View the bar chart and hover over the individual bars to see the correct amounts for each day
- See the current day's bar highlighted in a different colour to the other bars
- View the optimal layout for the content depending on their device's screen size
- See hover states for all interactive elements on the page
This was a really cool challenge that gave me an opportunity to spend some quality time with D3.js, which I’ve been meaning to look at for a while.
It seems the accessibility of most graphs are a nightmare. I’m surprised there isn’t a better way, and I empathise hard with screen reader users opening a web page full of graphs… but I hope the one I’ve made here is accessible enough for keyboard navigation and screen reader users compared to examples I saw in the wild.
Things I learned
SVG and D3.js
I had previously done basic SVG manipulation with JS, but never got too deep into it. After using D3.js, I’m blown away by how seamless it feels when you start to get over the steep initial learning curve.
I approached this challenge in a few small stages given this was the first graph I’ve tried to build. The stages were:
Manipulate SVG with just JavaScript
Was able to parse input data and draw bar items which had Y-axis scaling and dynamic X-axis positioning as a very basic first test of how you’d do this without a JS library.
I also learned how to responsively resize the SVG canvas and graph elements as its container changes size.
Build SVG graph with D3.js
Read through D3.js documentation, a few tutorials, and also reviewed examples of people building different types of graphs.
After this I understood how different D3 math & graph functions worked, and also how specific chart elements were added (axis labels, tooltips, reliable scaling etc).
Implement D3.js graph in React
At this point I felt comfortable enough that I understood what D3.js was doing to work this into React.
I assumed this could be done with useState, useRef and useEffect. After doing research on other implementations around the web, I was pretty surprised to find I wasn’t that far off the mark.
useLayoutEffect over useEffect for this case was an improvement identified in a few docs. We’re mutating the DOM directly during effect with D3.js/useRef, so we want our mutations in the effect to be executed after React’s DOM mutations are done, but before the browser repaints and shows React’s changes to the user.
Kind of surprised that there aren’t many actively maintained libraries for using React and D3 together at present. This strategy with hooks starts to feel a bit… large? I’d imagine some of the more complicated graphs would become a nightmare, but given how scary most vanilla D3.js implementations start to look, maybe this is just the accepted norm.
No media queries used
As someone who clung to media queries for all of life’s device size problems while learning front-end, it’s nice to finally be at a point where I’m using enough modern CSS to not require a single media query. Yay!
Useful resources
D3.js
Making React play nice with D3.js
- InfluxData - D3.js and React
- Nick Coughlin - D3.js and React
- Kent C Dodds - useEffect vs useLayoutEffect
SVG accessibility
- W3C - Graphics Module Roles spec - This provides a good explainer and some examples of the
graphics-symbolARIA role I’ve used for the bar graph<rect>elements, alongside thearia-roledescriptionandaria-labelstrategy for having these read out by screen readers correctly.